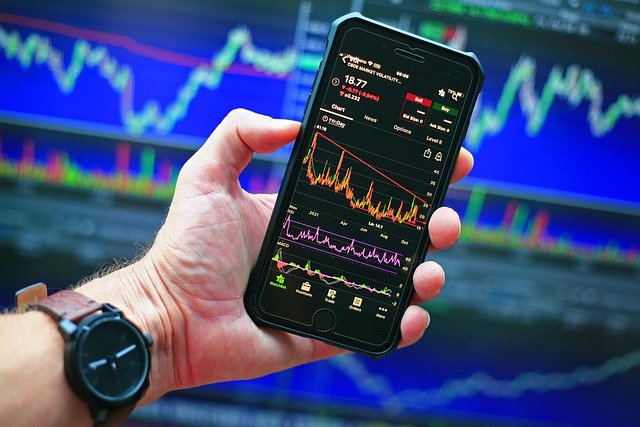
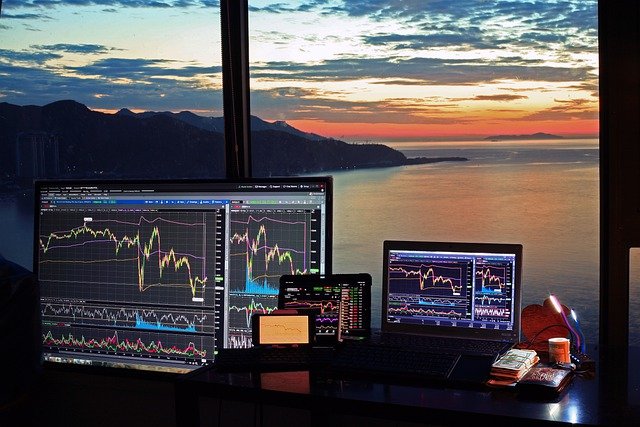
Traders use a variety of charts and technical indicators to analyze an individual stock as well as the overall market. They use stock charts on which they apply trendlines, Bollinger Bands, moving averages, Keltner Channels and other indicators to help them form opinions as to future price movements. They look for guidance on both the…
Category: Investing
What Causes Stock Market Volatility?
You may be wondering what causes stock market volatility? Stock prices can go up, down or “sideways” (stay about the same over time). Typically, long-term investors buy stocks in the hopes that prices of the stocks they own will increase as companies grow and enhance their profits. Short-term “traders,” or “swing traders,” who are more…
Can Candlesticks Be Used as Stock Momentum Indicators?
There are many popular technical indicators that traders use in an attempt to predict the future movement of a stock’s price. You may be wondering “Can candlesticks be used as stock momentum indicators?” A stock may be moving up, down or sideways, but traders need to predict if this direction or “trend” will continue in…
Demystifying Options Delta Metric: Options Delta Explained
Option “premiums,” that is, the prices that a trader must pay if he or she wants to buy an option, or the price that they will receive if they sell the option, are determined by a number of variables. These variables include the price of the underlying stock (or security), the volatility of the stock…
Stochastics Technical Analysis For Measuring Price Momentum
Trendlines, RSI, candlesticks, volume comparisons, moving averages, MACD, Bollinger Bands® and others are popular technical indicators that many traders use to predict the future movement of a stock’s price. Let’s look at the stochastic oscillator, a technical indicator that traders often use to plot when evaluating a stock. Stochastic Definition The stochastic oscillator measures the…
Demystifying The MACD Technical Indicator
The Moving Average Convergence/Divergence (MACD, pronounced “mack dee”), is a “momentum” and “trend direction” indicator, predicting the general direction and strength of a stock trend in the short-to-medium term. A MACD technical indicator is widely used, but often not interpreted correctly. What is MACD in Stock Charts? The “momentum” of price movement is the force…
An In-depth Look At Doji Candlesticks
Today, we’re going to take a close look at Doji candlesticks. Japanese candlestick charts are a popular tool used by traders, since candles give us a lot of information in one simple indicator. A single candle shows the relationship between the high, low, open and close for a given time period (an hour, a day,…
Trading Recommendations: Should You Pay for Stock Market and Option Trade Picking Services?
“Real-time buy and sell alerts, only $49 a month.” “Our team of experts use the latest technology to pick stocks for you.” “Our service gives you the hottest stocks ready for a breakout rally.” “Our artificial intelligence screener yields 30%, 60% and 90% returns in just days. Just take a look at our list of…
Investing in Property for Beginners: Tips and Tricks to Get You Started
There are countless ways to invest your hard-earned money these days and real estate is one of them. This guide “Investing in Property for Beginners” has the tips and tricks you need to get started. Roughly 50% of investors are currently choosing to put their money into real estate versus the stock market. It might…
Moving Average Charts: Simple But Powerful Tools For Traders
A common tool used by traders for identifying a stock price trend is moving average charts. Moving average indicators measure the mood of the market by revealing the directional trend of a stock. It is a smoothing technique that removes abrupt, choppy fluctuations (noise). Understanding the Moving Average System A stock’s closing price represents the…


